Page 14 - MemoriaOBN-Eng
P. 14
ORGANIZATION
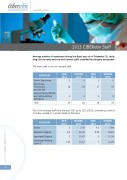
2013 CIBERobn Staff
Average number of employees during the fiscal year as of December 31, inclu-
ding civil servants and non-civil servant staff, classified by category and gender.
The entire staff is non-civil servant staff
MEN WOMEN MEN WOMEN
CATEGORY
2013
2013
2012 2012
Senior Executives
020 2
Executives,
58 17 53
Technicians 18
and the like
Administrative Officers
405 and Administrative 0
Assistants
62 19 58
Total 20
This is the average staff from the year 2013 up to 12/13/2013, considering a ratio of
1 full day worked to 1 worker based on
365 days.
WOMEN MEN MEN WOMEN
CATEGORY
2013
2013
2012
2012
Doctor 5
7.79 4.5 7.69
Bachelor’s Degree
9.9 24.34 9.98 25.63
3
01
Associate’s Degree
1
11.67
2
10.39
2
RT
Vocational Training, O
Level II
1.33
10.12
1
12.25
EP
R
AL
U
NN
A
/
N
OB
R
BE
CI
14