Page 13 - MEMOCiberes014-ENG
P. 13
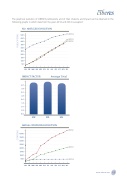
The graphical evolution of CIBERES publications and of their citations and impact can be observed in the following graphs in which data from the years 2012 and 2014 is analyzed
NO. ARTICLES EVOLUTION
500 450 400 350 300 250 200 150 100
50
4.0 3.5 3.0 2.5 2.0 1.5 1.0 0.5 0.0
4000 3500 3000 2500 2000 1500 1000
500
JAN FEB MAR APR MAY JUN JUL AUG SEP OCT NOV DEC
2012	2013	2014
2014
2013 2012
2012
2013
2014
IMPACT FACTOR	Average Total
ANUAL CITATIONS EVOLUTION
JAN FEB MAR APR MAY JUN JUL AUG SEP OCT NOV DEC
www.ciberes.org 13
CITATIONS	PUBLICATIONS